
Category: Escape-time Fractal
The following routine has originally been published in the book Maple V - Programming Guide by M.B. Monagan, K.O. Geddes, G. Labahn and S. Vorkoetter, Springer Verlag, and has been modified by John Oprea. It is a very clever way to avoid high computation times through using plot3d and its color option. The difficulty in plotting fractals with Maple V is that you cannot directly put pixels on the screen like in other programming languages (e.g. putpixel in Borland Pascal 7.0) but have to store them in a list for later display. This routine avoids this disadvantage.
# The Mandelbrot set
#
# 2D display coding by John Oprea, oprea@math.csuohio.edu

> restart: with(plots):

> mandelbrot := proc(x, y)
>    local c, z, m;
>    c := evalf(x+y*I);
>    z := c;
>    for m from 0 to 30 while abs(z) < 2 do
>       z := z^2+c
>    od;
>    m
> end:

> plot3d(0, -2 .. 0.7, -1.2 .. 1.2, orientation=[-90,0], grid=[250, 250],
>    style=patchnogrid, scaling=constrained, color=mandelbrot);

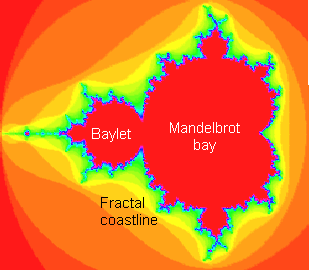
(Designations according to the book Fractals for Windows by Tim Wegner, Bert Typler, Mark Peterson, and Pieter Branderhorst, published by The Waite Group.)
> plot3d(0, -0.83561 .. -0.78523, 0.15559 .. 0.19343, orientation=[-90,0],
>    grid=[250, 250], style=patchnogrid, scaling=constrained, color=mandelbrot);

The procedure uses the fact that Maple can color things according to a function. Also, plotting the zero function keeps the graph in a plane.
Increasing the values of grid in the plot3d command results in a better resolution of the fractal, but results in an increased processing time.
You can view special regions of the Mandelbrot set by changing the second and third parameters of the plot3d command.
style=patchnogrid draws the surface with shaded rectangular patches but without a wireframe grid. This is the best style option for this routine.
The procedure mandelbrot returns the value m. The larger m the more likely is the probability that the point (x, y) belongs to the Mandelbrot set. Certainly m depends on the number of iterations (here: 30). It is possible that a point satisfies the condition abs(z) < 2 after n iterations but is outside the range after n+1 iterations. So to make sure that (x, y) is part of the set you would have to do infinite iterations.
m is used in the 'color=mandelbrot' option to visualize the set: the red area - the Mandelbrot lake - indicates that it is part of the set (however the red border of the image does not belong to the set).
See MandelbrotFast for a procedure that processes the Mandelbrot set much faster.
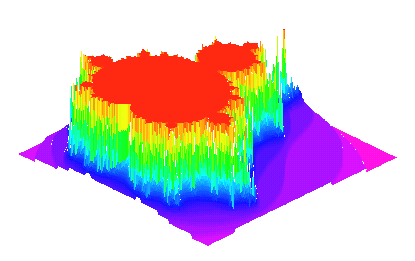
A 3-dimensional Mandelbrot set:
> restart:

> mandelbrot := proc(x, y)
>    local z, c, m;
>    z := evalf(x+y*I);
>    for m from 0 to 25 while abs(z) < 2 do
>       z := z^2 + c
>    od;
>    m
> end:

> plot3d(mandelbrot, -2 .. 0.5, -1.2 .. 1.2, grid=[200, 200],
>    style=patchnogrid, shading=zhue, orientation=[45, 35]);


MAPLE V FRACTALS MANDELBROT #1.01 current as of May 23, 1999
Author: Alexander F. Walz, alexander.f.walz@t-online.de
Original file location: http://www.math.utsa.edu/mirrors/maple/mfrmand.htm