
Category: Logistic Equation
The original algorithm was developed by P. F. Verhulst in 1845 to describe the increase in population of animals (including humans as well ...). It uses the Logistic Equation
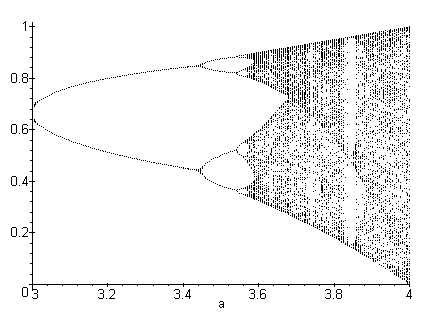
Starting with any value for x = [0 .. 1] the 'curve' splits in two at r = 3 (hence the name 'bifurcation' and behaves chaotically with r > 3.56994 ... Note the empty spaces in the graph.
Author of the following procedures is Alain Schauber, Forbach, France.
> restart: with(plots):

> feigenbaum:=proc(debut,fin,pas)
>    # written by Alain Schauber, Forbach, France, aschau@worldnet.fr
>    local k, itere, a, b, s;
>    s := {};
>    a := debut;
>    # la variable s va repr_senter l'ensemble des points _ construire
>    while a <= fin do
>       itere := 0.1;
>       for k to 50 do
>          itere := a*itere*(1-itere)
>       od;
>       for k to 100 do
>          itere := a*itere*(1-itere);
>          s:=s union {[a, evalf(itere, 4)]};
>       od;
>       a := a+pas
>    od;
>    plot([op(s)], 'a'=debut .. fin, style=POINT, symbol=POINT)
> end:

> feigenbaum(3, 4, 0.01); # overview

> lignes_critiques := proc(n)
>    # written by Alain Schauber, Forbach, France
>    local f, l, k;
>    f := (a,x) -> a*x*(1-x);
>    l := NULL;
>    for k to n do
>       l := l, plot((unapply(a*x*(1-x),x)@@k)(.5),
>               a=3.55 .. 4, y=0 .. 1, color=black)
>    od;
> end:

> display({lignes_critiques(4)});

> display({lignes_critiques(10)});

> display({lignes_critiques(8), feigenbaum(3.55, 4, 0.01)});


MAPLE V FRACTALS BIFURCATION #1.01 current as of November 29, 1996
Author: Alexander F. Walz, alexander.f.walz@t-online.de
Original file location: http://www.math.utsa.edu/mirrors/maple/mfrbif.htm